# !pip3.9 install dtaidistance
# !pip3.9 install numpy
# !pip3.9 install matplotlib
from dtaidistance import dtw
from dtaidistance import dtw_visualisation as dtwvis
from random import sample
import numpy as np
import matplotlib.pyplot as plt
x = np.arange(0, 20, .5)
s1 = np.sin(x)
s2 = np.sin(x - 1)
path = dtw.warping_path(s1, s2)
dtwvis.plot_warping(s1, s2, path)
distance = dtw.distance(s1, s2)

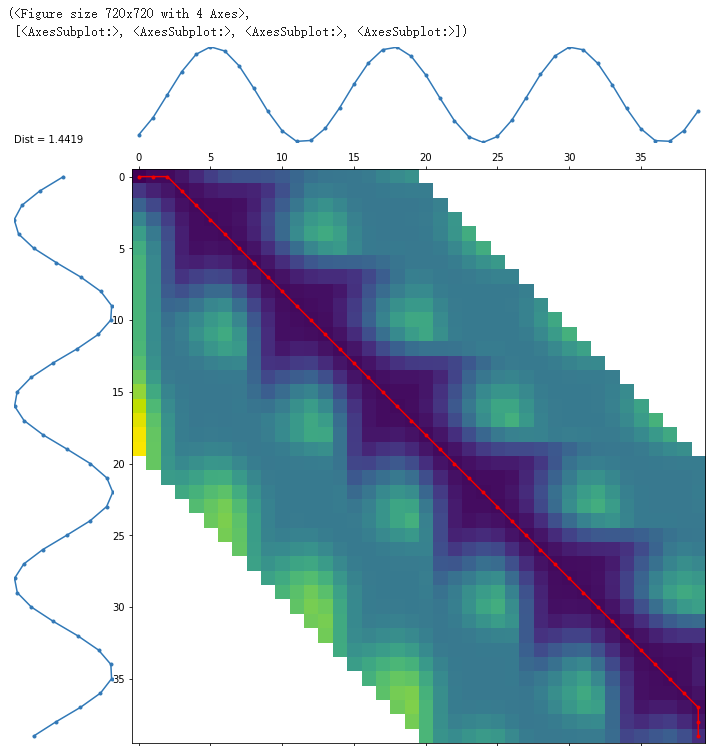
d, paths = dtw.warping_paths(s1, s2, window=20)
best_path = dtw.best_path(paths)
dtwvis.plot_warpingpaths(s1, s2, paths, best_path)

# function that takes as input the number of neigbors of KNN and the # index of the time series in the test set, and returns one of the
# labels: WALKING, WALKING_UPSTAIRS, WALKING_DOWNSTAIRS, SITTING,
# STANDING, LAYING
def classifyNN(k:int, idx:int) -> str:
    idxs=range(0,x_train.shape[0])
    n=x_train.shape[0]
    distances=[]
    counters={}
    c=1;
    max_value=0
    for r in range(n):
        distances.append(dtw.distance(x_test[idx], x_train[idxs[r]],window=10,use_pruning=True))
    NN=sorted(range(len(distances)), key=lambda i: distances[i], reverse=False)[:k]

    for l in labels.values():
        counters[l]=0
    for r in NN:
        l=labels[y_train[r]]
        counters[l]+=1
        if (counters[l])>max_value:
            max_value=counters[l]
        #print('NN(%d) has label %s' % (c,l))
        c+=1

    # find the label(s) with the highest frequency
    keys = [k for k in counters if counters[k] == max_value]

    # in case of a tie, return one at random
    return (sample(keys,1)[0])
k=20
idx=3
plt.plot(x_test[idx], label=labels[y_test[idx]], color=colors[y_test[idx]-1], linewidth=2)
plt.xlabel('Samples @50Hz')
plt.legend(loc='upper left')
plt.tight_layout()

classifyNN(k,idx)


