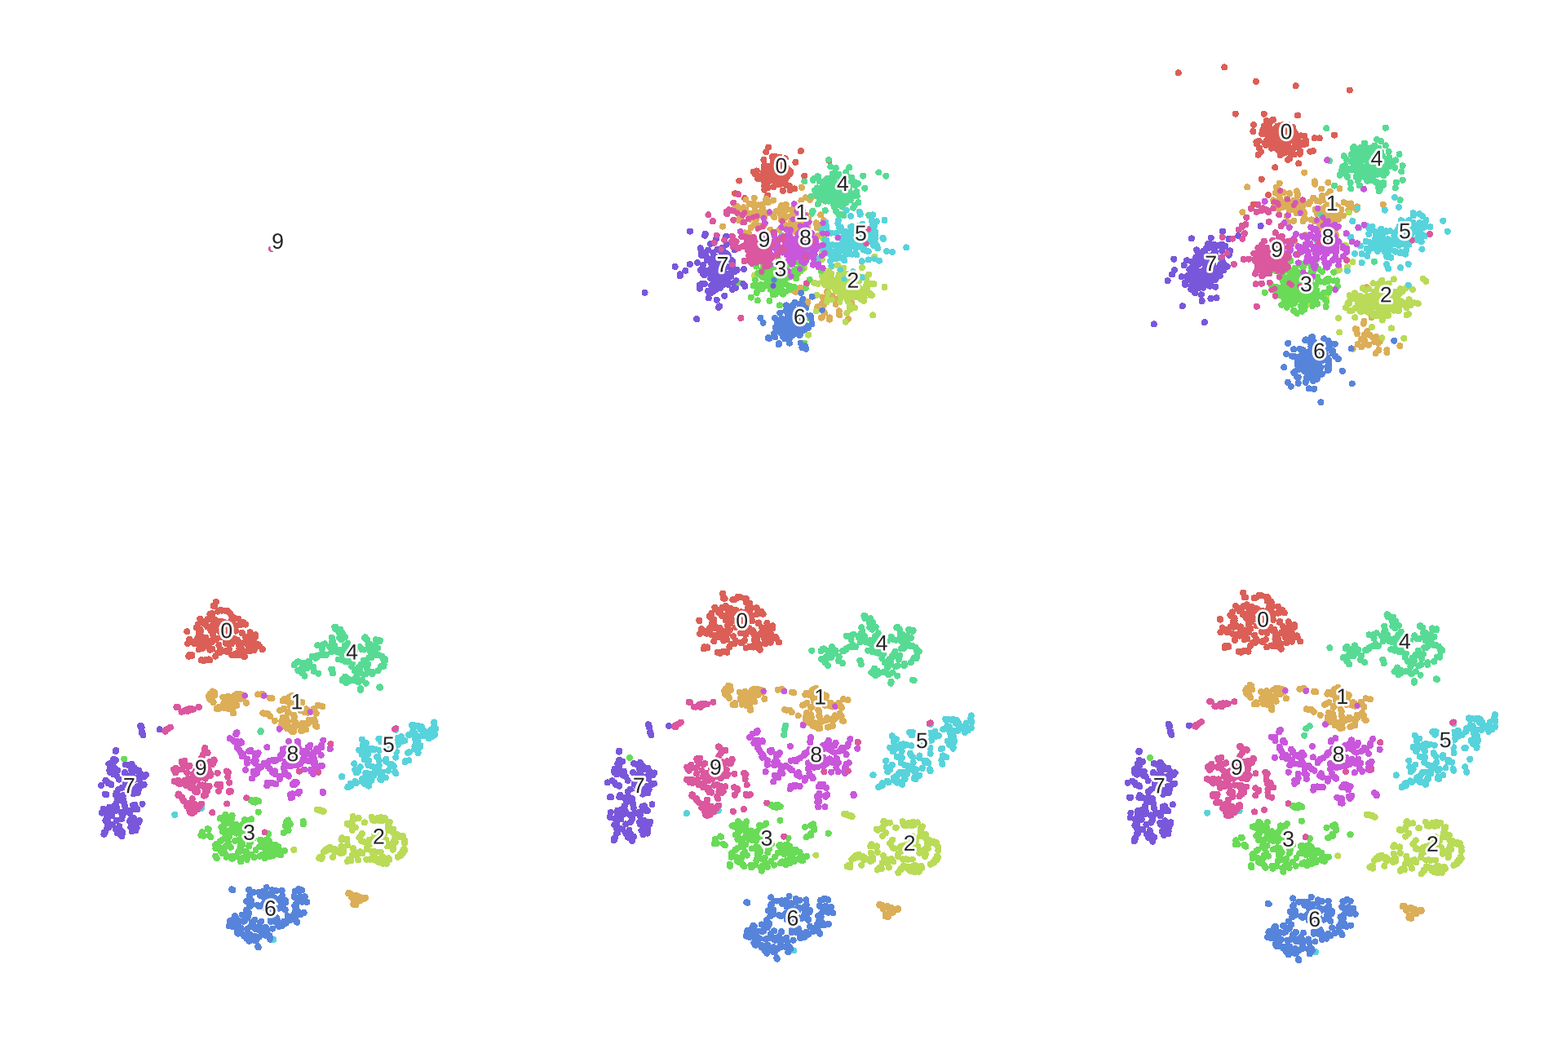
FitFunction

目录
1. SNE 基本原理


2. 目标函数求解

3. 对称 SNE

4. t-SNE
在对称
的改进是,首先通过在
高维空间中使用高斯分布将距离转换为概率分布,然后在低维空间中,使用更加偏重长尾分布的方式来将距离转换为概率分布,使得高维度空间中的中低等距离在映射后能够有一个较大的距离。

在没有异常点时,
分布与高斯分布的拟合结果基本一致。而在第二张图中,出现了部分异常点,由于高斯分布的尾部较低,对异常点比较敏感,为了照顾这些异常点,高斯分布的拟合结果偏离了大多数样本所在位置,方差也较大。相比之下,
分布的尾部较高,对异常点不敏感,保证了其鲁棒性,因此拟合结果更为合理,较好的捕获了数据的全局特征。

5. 代码
.1. t-SNE
# That's an impressive list of imports.
import numpy as np
from numpy import linalg
from numpy.linalg import norm
from scipy.spatial.distance import squareform, pdist

# We import sklearn.
import sklearn
from sklearn.manifold import TSNE
from sklearn.datasets import load_digits
from sklearn.preprocessing import scale

# We'll hack a bit with the t-SNE code in sklearn 0.15.2.
from sklearn.metrics.pairwise import pairwise_distances
from sklearn.manifold.t_sne import (_joint_probabilities,
                                    _kl_divergence)
from sklearn.utils.extmath import _ravel
# Random state.
RS = 20150101

# We'll use matplotlib for graphics.
import matplotlib.pyplot as plt
import matplotlib.patheffects as PathEffects
import matplotlib
%matplotlib inline

# We import seaborn to make nice plots.
import seaborn as sns
sns.set_style('darkgrid')
sns.set_palette('muted')
sns.set_context("notebook", font_scale=1.5,
                rc={"lines.linewidth": 2.5})

# We'll generate an animation with matplotlib and moviepy.
from moviepy.video.io.bindings import mplfig_to_npimage
import moviepy.editor as mpy
digits = load_digits()
digits.data.shape
# We first reorder the data points according to the handwritten numbers.
X = np.vstack([digits.data[digits.target==i]
               for i in range(10)])
y = np.hstack([digits.target[digits.target==i]
               for i in range(10)])
digits_proj = TSNE(random_state=RS).fit_transform(X)

def scatter(x, colors):
    # We choose a color palette with seaborn.
    palette = np.array(sns.color_palette("hls", 10))

    # We create a scatter plot.
    f = plt.figure(figsize=(8, 8))
    ax = plt.subplot(aspect='equal')
    sc = ax.scatter(x[:,0], x[:,1], lw=0, s=40,
                    c=palette[colors.astype(np.int)])
    plt.xlim(-25, 25)
    plt.ylim(-25, 25)
    ax.axis('off')
    ax.axis('tight')

    # We add the labels for each digit.
    txts = []
    for i in range(10):
        # Position of each label.
        xtext, ytext = np.median(x[colors == i, :], axis=0)
        txt = ax.text(xtext, ytext, str(i), fontsize=24)
        txt.set_path_effects([
            PathEffects.Stroke(linewidth=5, foreground="w"),
            PathEffects.Normal()])
        txts.append(txt)

    return f, ax, sc, txts
scatter(digits_proj, y)
plt.savefig('images/digits_tsne-generated.png', dpi=120)

.2. t-SNE gif
# That's an impressive list of imports.
import numpy as np
from numpy import linalg
from numpy.linalg import norm
from scipy.spatial.distance import squareform, pdist

# We import sklearn.
import sklearn
from sklearn.manifold import TSNE
from sklearn.datasets import load_digits
from sklearn.preprocessing import scale

# We'll hack a bit with the t-SNE code in sklearn 0.15.2.
from sklearn.metrics.pairwise import pairwise_distances
from sklearn.manifold.t_sne import (_joint_probabilities,
                                    _kl_divergence)

# Random state.
RS = 20150101

# We'll use matplotlib for graphics.
import matplotlib.pyplot as plt
import matplotlib.patheffects as PathEffects
import matplotlib


# We import seaborn to make nice plots.
import seaborn as sns
sns.set_style('darkgrid')
sns.set_palette('muted')
sns.set_context("notebook", font_scale=1.5,
                rc={"lines.linewidth": 2.5})

# We'll generate an animation with matplotlib and moviepy.
from moviepy.video.io.bindings import mplfig_to_npimage
import moviepy.editor as mpy
digits = load_digits()
digits.data.shape
# We first reorder the data points according to the handwritten numbers.
X = np.vstack([digits.data[digits.target==i]
               for i in range(10)])
y = np.hstack([digits.target[digits.target==i]
               for i in range(10)])
digits_proj = TSNE(random_state=RS).fit_transform(X)

def scatter(x, colors):
    # We choose a color palette with seaborn.
    palette = np.array(sns.color_palette("hls", 10))

    # We create a scatter plot.
    f = plt.figure(figsize=(8, 8))
    ax = plt.subplot(aspect='equal')
    sc = ax.scatter(x[:,0], x[:,1], lw=0, s=40,
                    c=palette[colors.astype(np.int)])
    plt.xlim(-25, 25)
    plt.ylim(-25, 25)
    ax.axis('off')
    ax.axis('tight')

    # We add the labels for each digit.
    txts = []
    for i in range(10):
        # Position of each label.
        xtext, ytext = np.median(x[colors == i, :], axis=0)
        txt = ax.text(xtext, ytext, str(i), fontsize=24)
        txt.set_path_effects([
            PathEffects.Stroke(linewidth=5, foreground="w"),
            PathEffects.Normal()])
        txts.append(txt)

    return f, ax, sc, txts
# scatter(digits_proj, y)
# plt.savefig('images/digits_tsne-generated.png', dpi=120)
# def _joint_probabilities_constant_sigma(D, sigma):
#     P = np.exp(-D**2/2 * sigma**2)
#     P /= np.sum(P, axis=1)
#     return P
#     # Pairwise distances between all data points.
# D = pairwise_distances(X, squared=True)
# # Similarity with constant sigma.
# P_constant = _joint_probabilities_constant_sigma(D, .002)
# # Similarity with variable sigma.
# P_binary = _joint_probabilities(D, 30., False)
# # The output of this function needs to be reshaped to a square matrix.
# P_binary_s = squareform(P_binary)

# plt.figure(figsize=(12, 4))
# pal = sns.light_palette("blue", as_cmap=True)

# plt.subplot(131)
# plt.imshow(D[::10, ::10], interpolation='none', cmap=pal)
# plt.axis('off')
# plt.title("Distance matrix", fontdict={'fontsize': 16})

# plt.subplot(132)
# plt.imshow(P_constant[::10, ::10], interpolation='none', cmap=pal)
# plt.axis('off')
# plt.title("$p_{j|i}$ (constant $\sigma$)", fontdict={'fontsize': 16})

# plt.subplot(133)
# plt.imshow(P_binary_s[::10, ::10], interpolation='none', cmap=pal)
# plt.axis('off')
# plt.title("$p_{j|i}$ (variable $\sigma$)", fontdict={'fontsize': 16})
# plt.savefig('similarity-generated.png', dpi=120)

# This list will contain the positions of the map points at every iteration.
positions = []
def _gradient_descent(objective, p0, it, n_iter, n_iter_without_progress=30,
                      momentum=0.5, learning_rate=1000.0, min_gain=0.01,
                      min_grad_norm=1e-7, min_error_diff=1e-7, verbose=0,
                      args=[]):
    # The documentation of this function can be found in scikit-learn's code.
    p = p0.copy().ravel()
    update = np.zeros_like(p)
    gains = np.ones_like(p)
    error = np.finfo(np.float).max
    best_error = np.finfo(np.float).max
    best_iter = 0

    for i in range(it, n_iter):
        # We save the current position.
        positions.append(p.copy())

        new_error, grad = objective(p, *args)
        error_diff = np.abs(new_error - error)
        error = new_error
        grad_norm = linalg.norm(grad)

        if error < best_error:
            best_error = error
            best_iter = i
        elif i - best_iter > n_iter_without_progress:
            break
        if min_grad_norm >= grad_norm:
            break
        if min_error_diff >= error_diff:
            break

        inc = update * grad >= 0.0
        dec = np.invert(inc)
        gains[inc] += 0.05
        gains[dec] *= 0.95
        np.clip(gains, min_gain, np.inf)
        grad *= gains
        update = momentum * update - learning_rate * grad
        p += update

    return p, error, i

sklearn.manifold.t_sne._gradient_descent = _gradient_descent
X_proj = TSNE(random_state=RS).fit_transform(X)
X_iter = np.dstack(position.reshape(-1, 2)
                   for position in positions)

f, ax, sc, txts = scatter(X_iter[..., -1], y)

def make_frame_mpl(t):
    i = int(t*40)
    x = X_iter[..., i]
    sc.set_offsets(x)
    for j, txt in zip(range(10), txts):
        xtext, ytext = np.median(x[y == j, :], axis=0)
        txt.set_x(xtext)
        txt.set_y(ytext)
    return mplfig_to_npimage(f)

animation = mpy.VideoClip(make_frame_mpl,
                          duration=X_iter.shape[2]/40.)
animation.write_gif("./animation-94a2c1ff.gif", fps=20)

.3. t-SNE &PCA
from sklearn.manifold import TSNE
from sklearn.datasets import load_iris,load_digits
from sklearn.decomposition import PCA
import matplotlib.pyplot as plt
import numpy as np
%config InlineBackend.figure_format = "svg"

digits = load_digits()
X_tsne = TSNE(n_components=2, random_state=33).fit_transform(digits.data)
X_pca = PCA(n_components=2).fit_transform(digits.data)

font = {"color": "darkred",
        "size": 13,
        "family" : "serif"}

plt.style.use("dark_background")
plt.figure(figsize=(8.5, 4))
plt.subplot(1, 2, 1)
plt.scatter(X_tsne[:, 0], X_tsne[:, 1], c=digits.target, alpha=0.6,
            cmap=plt.cm.get_cmap('rainbow', 10))
plt.title("t-SNE", fontdict=font)
cbar = plt.colorbar(ticks=range(10))
cbar.set_label(label='digit value', fontdict=font)
plt.clim(-0.5, 9.5)
plt.subplot(1, 2, 2)
plt.scatter(X_pca[:, 0], X_pca[:, 1], c=digits.target, alpha=0.6,
            cmap=plt.cm.get_cmap('rainbow', 10))
plt.title("PCA", fontdict=font)
cbar = plt.colorbar(ticks=range(10))
cbar.set_label(label='digit value', fontdict=font)
plt.clim(-0.5, 9.5)
plt.tight_layout()
